0.4: Defining a Function
In mathematics, functions communicate relationships between numbers, enabling us to go from one number to another. How do we describe these functions' properties, and what are their applications? In this section we discuss the following topics:
Defining a Function
A function is a rule that maps one number to another.
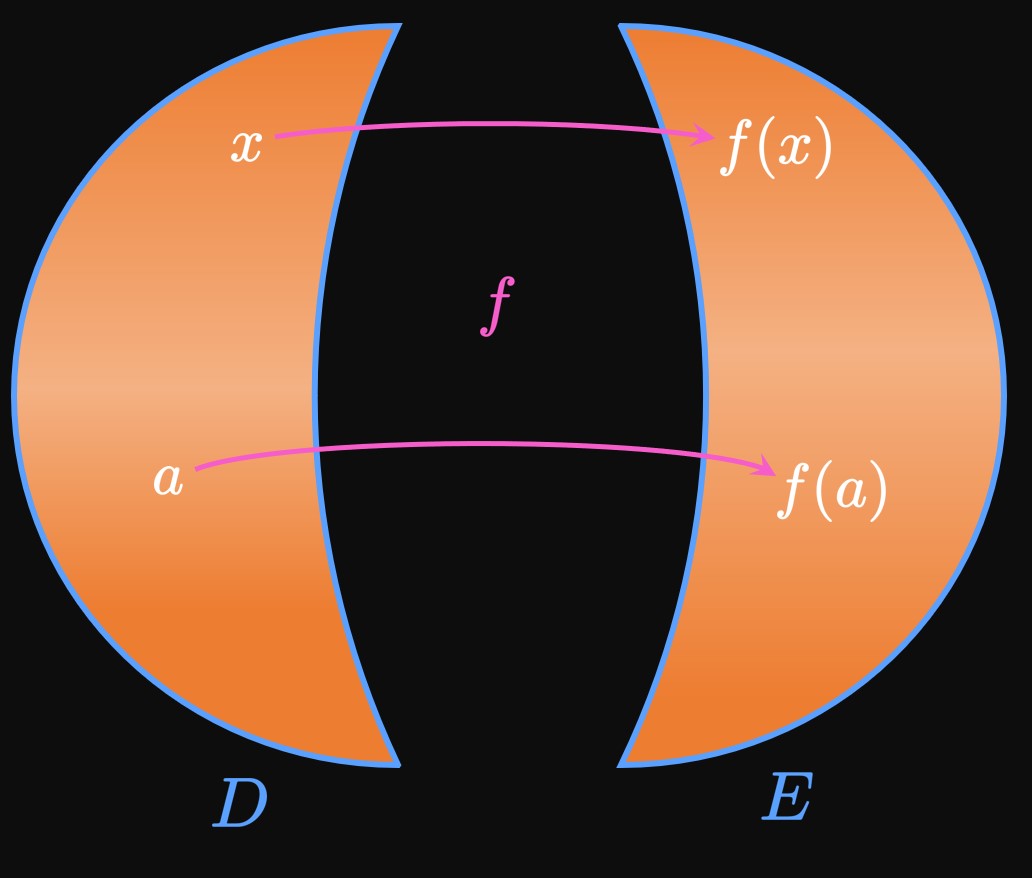
Formally, a function \(f\) assigns each element \(x\) in some set \(D\) (the domain)
to exactly one element, \(f(x),\) in another set \(E\) (the range).
We read \(f(x)\) as \(f\) of
; it represents the value of \(f\) at \(x.\)
Thus, a function works similarly to a machine:
When we input a number \(x\) within \(D\) into the machine,
the machine yields an output \(f(x)\) within \(E.\)
(See Figure 1.)
Accordingly, the domain is the set of all possible inputs and the range is the set of all possible outputs.
We have four ways of conveying a function—verbally (through a description in words), visually (through a graph), numerically (through a table of values), and algebraically (through a formula). Graphs are the most common method of visualizing a function: if \(f\) is a function with domain \(D,\) then the graph of \(y = f(x)\) consists of all ordered pairs \[\{(x, f(x)) \mid x \in D\} \pd\] In words, the function \(f\) gives the \(y\)-value at a particular value of \(x\) in the domain.
| Year | 2020 | 2021 | 2022 | 2023 | 2024 |
| Population | \(5600\) | \(5750\) | \(5900\) | \(6200\) | \(6600\) |
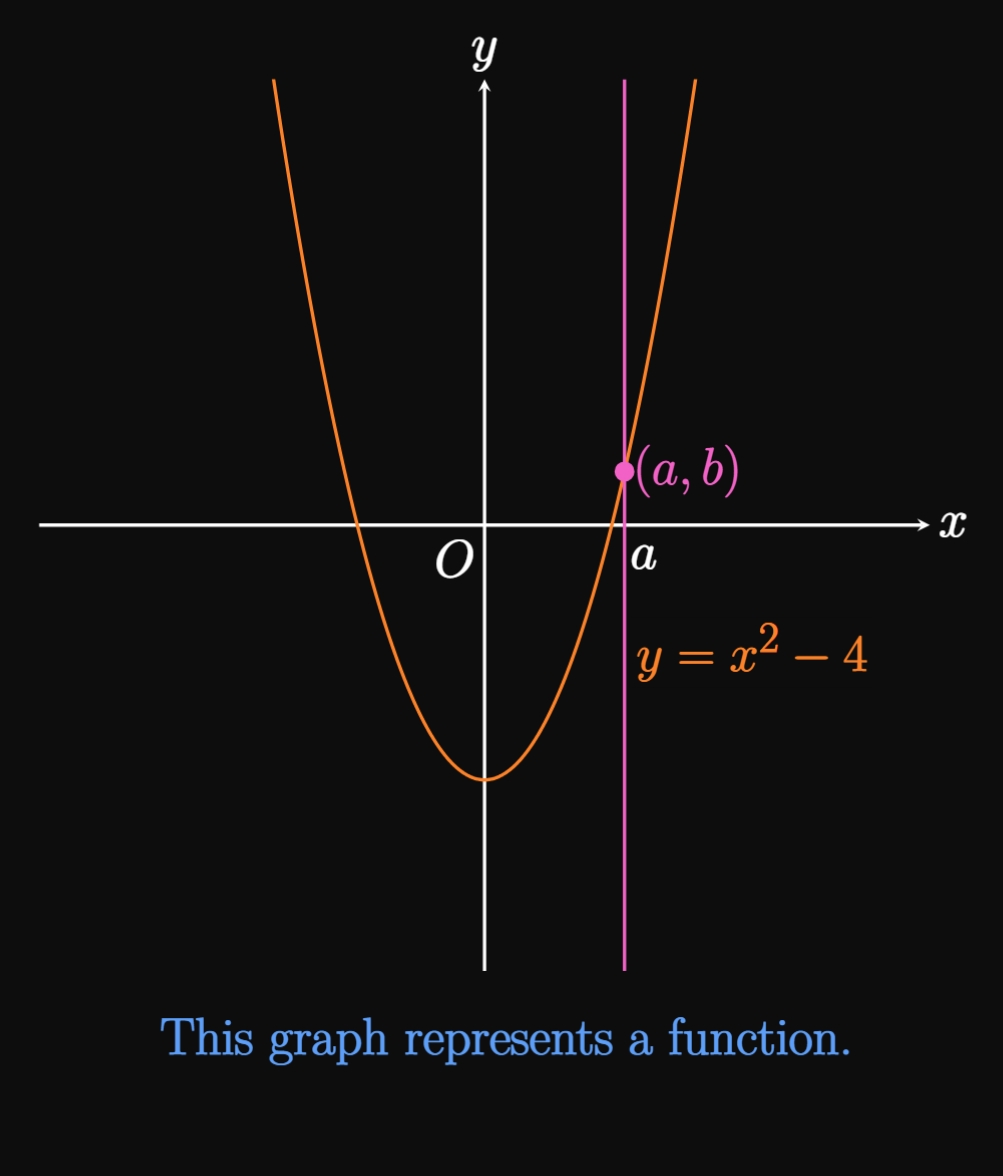
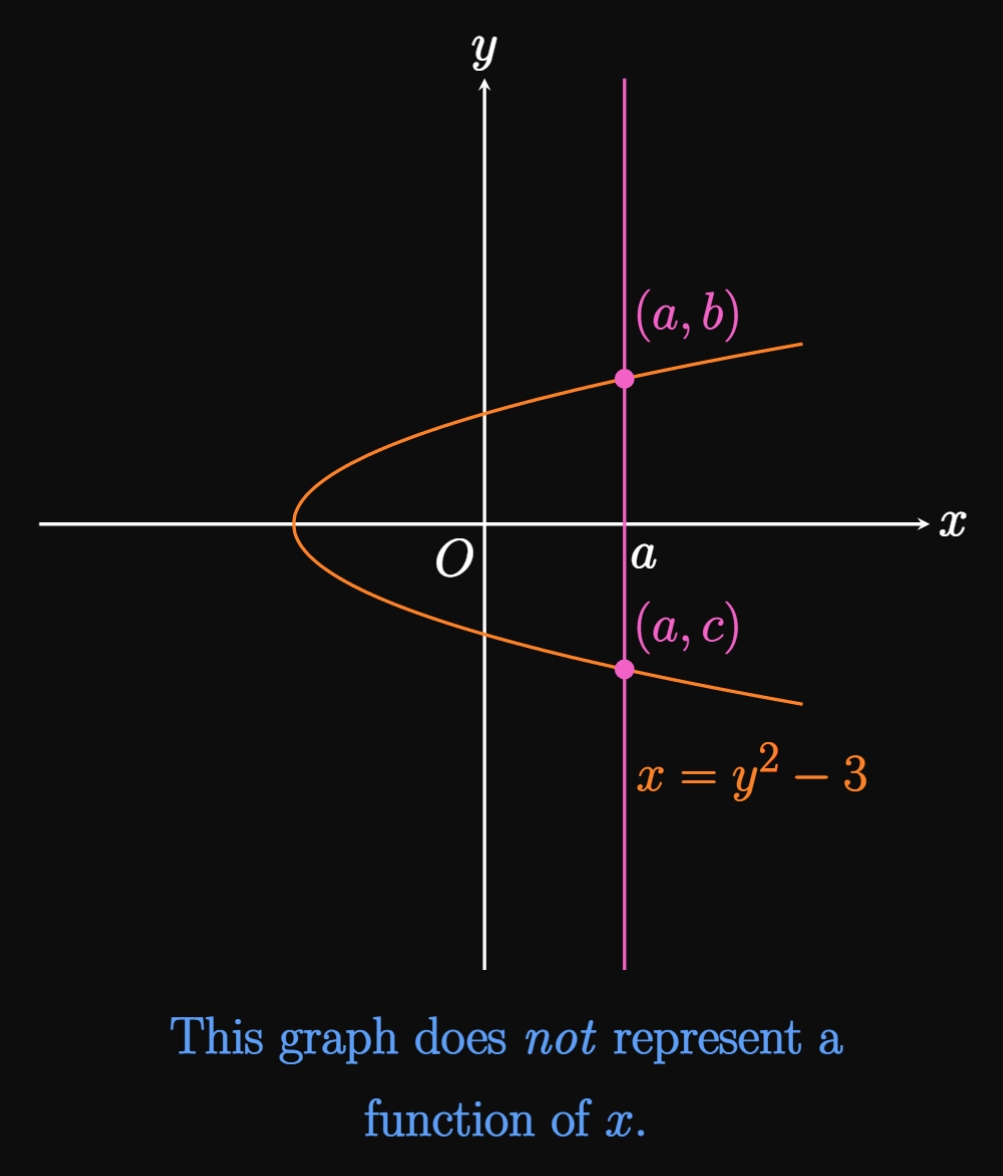
Plotting a function in the \(xy\)-plane yields a graph. But do all graphs represent functions? The answer is no. A function assigns each \(x\) to exactly one \(y,\) so any vertical line must intersect the graph only once. Otherwise, the graph does not represent a function of \(x.\) This condition is called the Vertical Line Test.
In Figure 3A the graph of \(y = x^2 - 4\) represents \(y\) as a function of \(x\) because a vertical line drawn at any \(x = a\) strikes the curve only once at \((a, b).\) Conversely, the graph of \(x = y^2 - 3\) does not represent \(y\) as a function of \(x,\) since a vertical line shown in Figure 3B hits the curve at both \((a, b)\) and \((a, c),\) where \(b \ne c.\)
In the next examples, we plot a variety of essential mathematical functions. When we find domains of functions, it's easiest to consider what numbers the inputs cannot be. Then the domain is all real numbers excluding those values, as shown by the following examples.
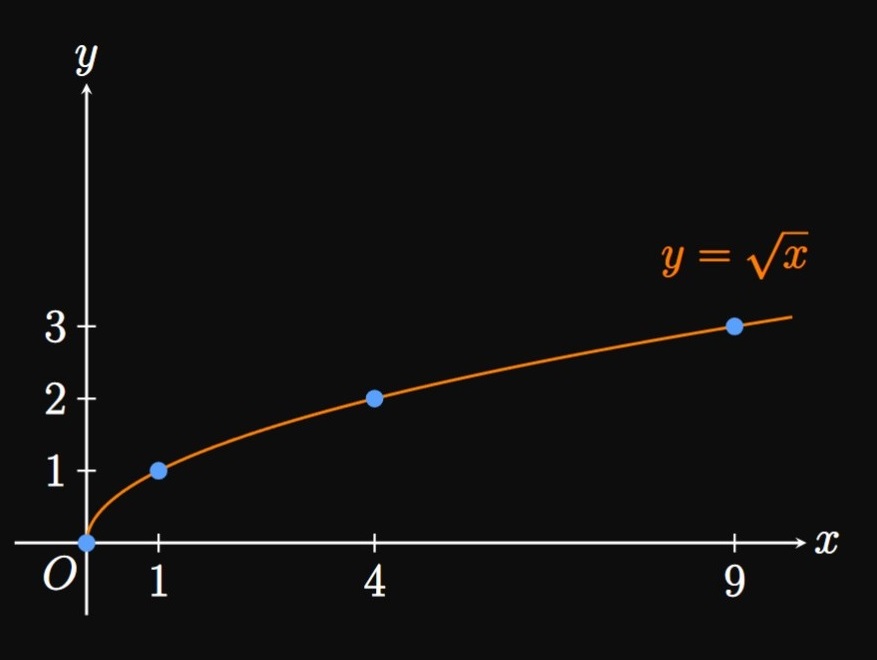
| \(x\) | \(0\) | \(1\) | \(4\) | \(9\) |
| \(\sqrt x\) | \(0\) | \(1\) | \(2\) | \(3\) |

| \(x\) | \(-3\) | \(-2\) | \(-1\) | \(-1/2\) | \(1/2\) | \(1\) | \(2\) | \(3\) |
| \(1/x\) | \(-1/3\) | \(-1/2\) | \(-1\) | \(-2\) | \(2\) | \(1\) | \(1/2\) | \(1/3\) |
- \(\ds f(x) = \sqrt{x - 5}\)
- \(\ds g(x) = \frac{1}{x^2 - 4x}\)
- The square root of a negative number is undefined (as a real number). Therefore, the domain of \(f\) is all \(x\)-values such that \(x - 5\) is nonnegative—namely, \[ \ba \{x \mid x - 5 \geq 0\} &= \{x \mid x \geq 5\} \nl &= \boxed{[5, \infty)} \ea \]
- Recall that division by \(0\) is undefined, so the domain of \(g\) is restricted to all \(x\) such that the denominator is nonzero. The denominator equals \(0\) when \[x^2 - 4x = x(x - 4) = 0 \cma\] whose solutions are \(x = 0\) and \(x = 4.\) Hence, the domain of \(g\) is \[\{x \mid x \ne 0 \text{ and } x \ne 4 \} = \boxed{(-\infty, 0) \cup (0, 4) \cup (4, \infty)}\]
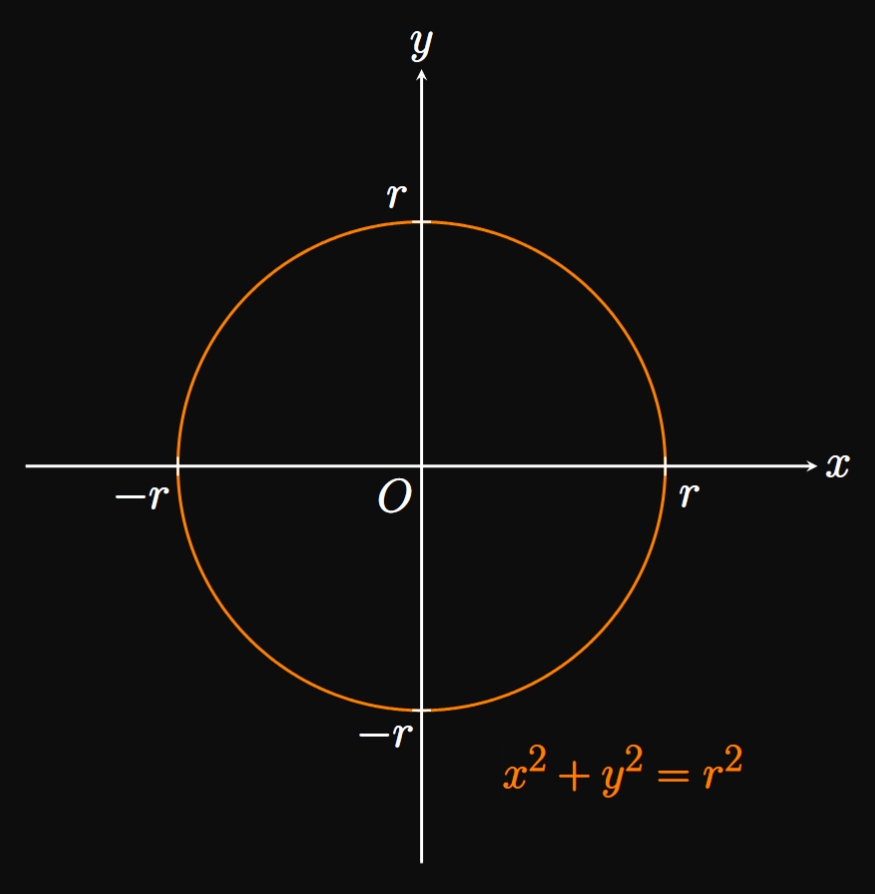
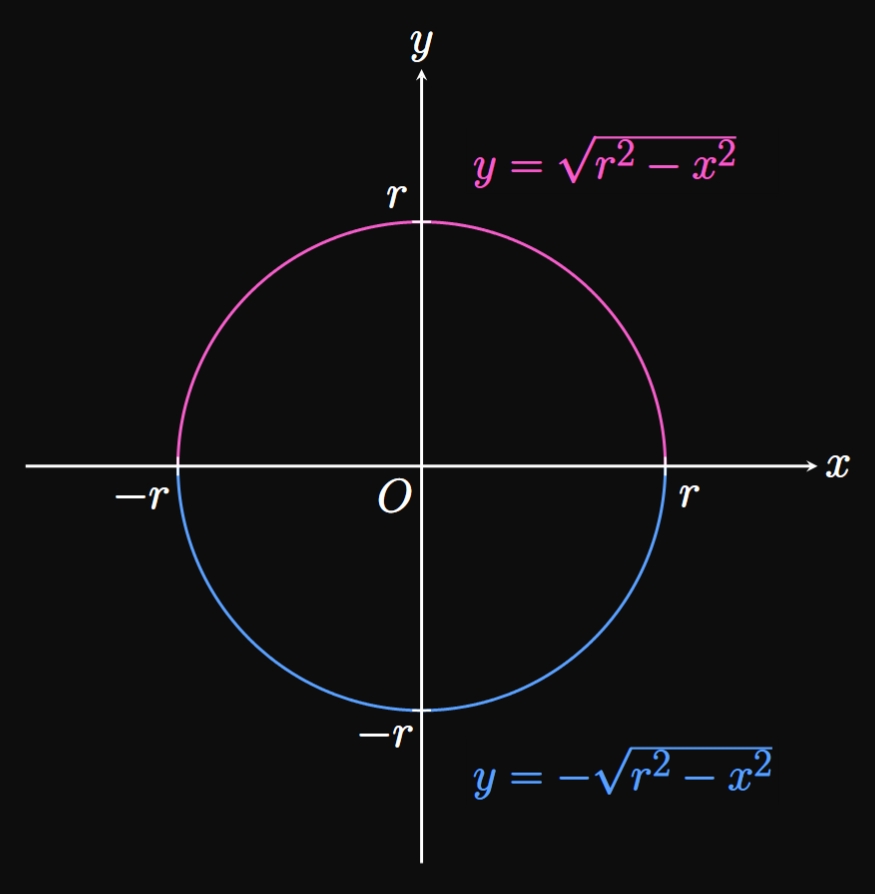
Semicircles Recall, from Section 0.3, that the Cartesian equation of a circle of radius \(r\) centered at the origin is \begin{equation} x^2 + y^2 = r^2 \pd \label{eq:circle-r} \end{equation} (See Figure 6A.) Circles clearly fail the Vertical Line Test, but a function can represent either the top or bottom portion. Solving for \(y\) in \(\eqref{eq:circle-r}\) yields \(y^2 = r^2 - x^2.\) Taking the square root of both sides gives \[ \ba \abs y &= \sqrt{r^2 - x^2} \nl y &= \pm \sqrt{r^2 - x^2} \pd \ea \] Accordingly, we have two solutions: \[y = \sqrt{r^2 - x^2} \and y = -\sqrt{r^2 - x^2} \cma\] which each represent \(y\) as a function of \(x.\) The positive solution, \(y = \sqrt{r^2 - x^2},\) is the upper half of the circle—that is, a semicircle of radius \(r\) above the \(x\)-axis. Likewise, the negative solution, \(y = -\sqrt{r^2 - x^2},\) represents the bottom half of the circle—namely, a semicircle of radius \(r\) below the \(x\)-axis. (See Figure 6B.) Both functions have a domain of \([-r, r]\) to ensure that \(r^2 - x^2 \geq 0\) (otherwise, the argument of the square root is negative).
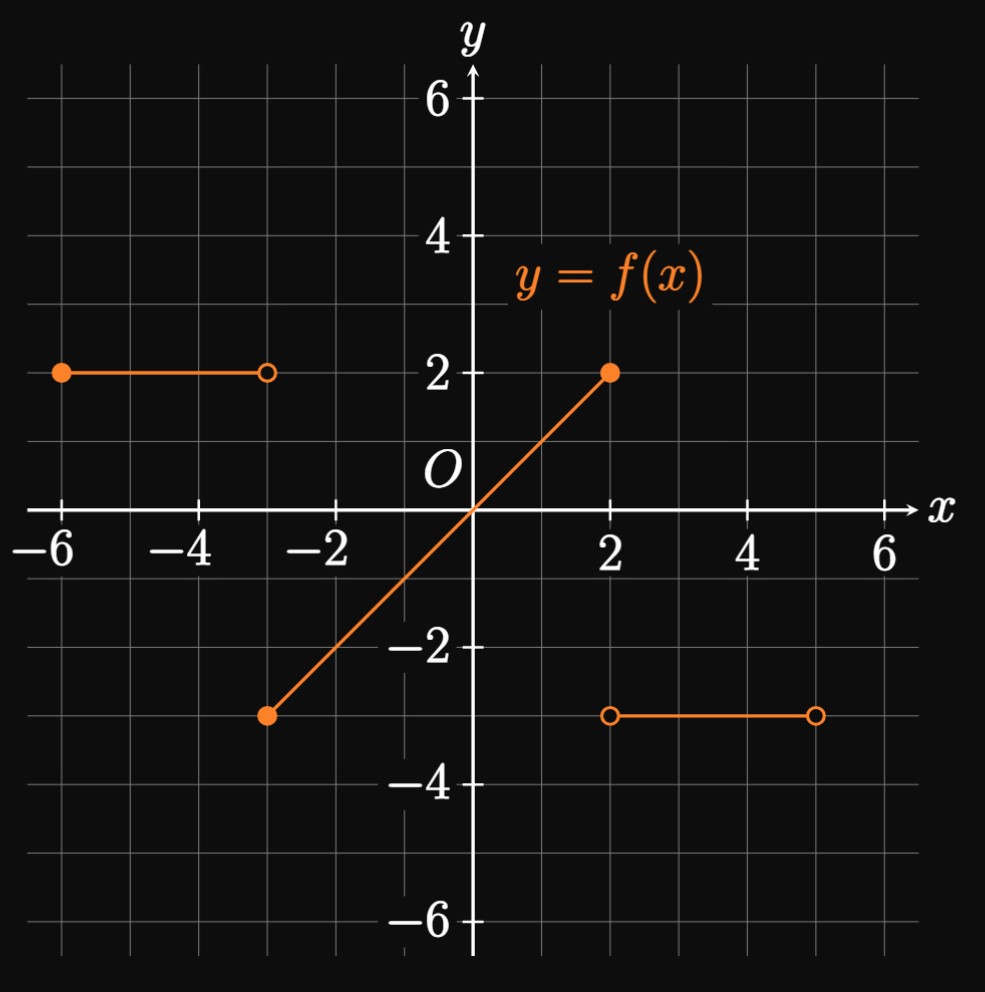
Piecewise Functions
A piecewise function is defined by different subfunctions for various parts of its domain. In the following examples, we graph these functions.
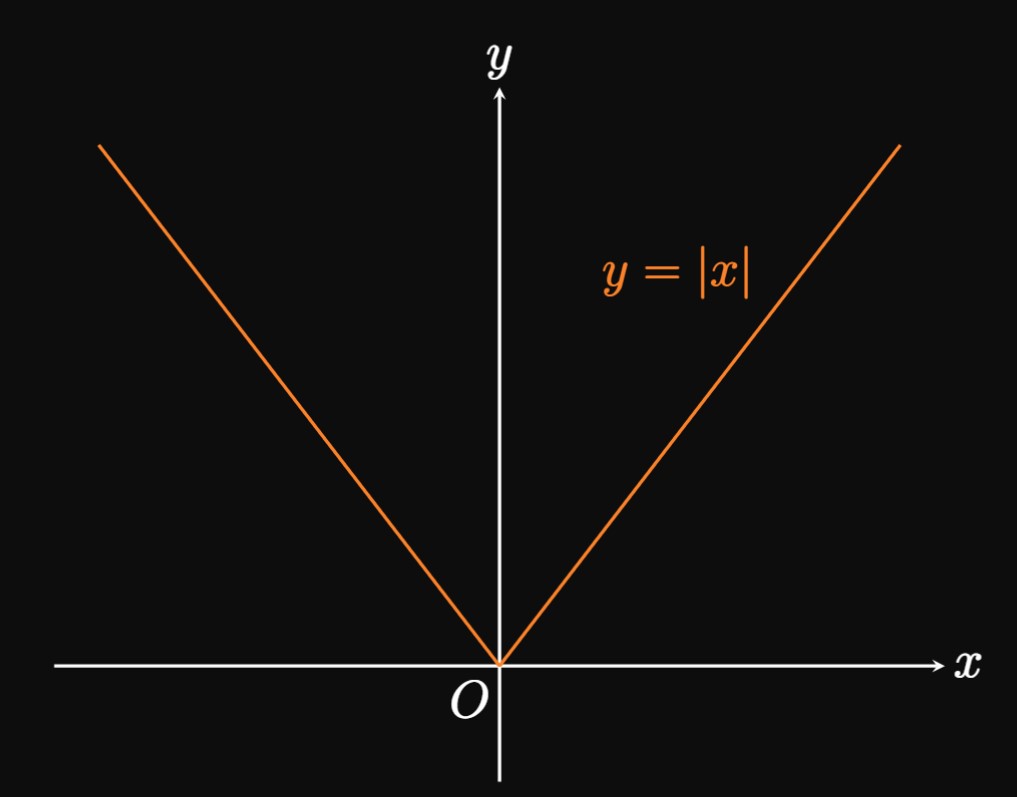
Absolute Value Function
Recall, from Section 0.2,
that taking the absolute value of a number \(a\) removes its negative sign.
(For example,
Even and Odd Functions
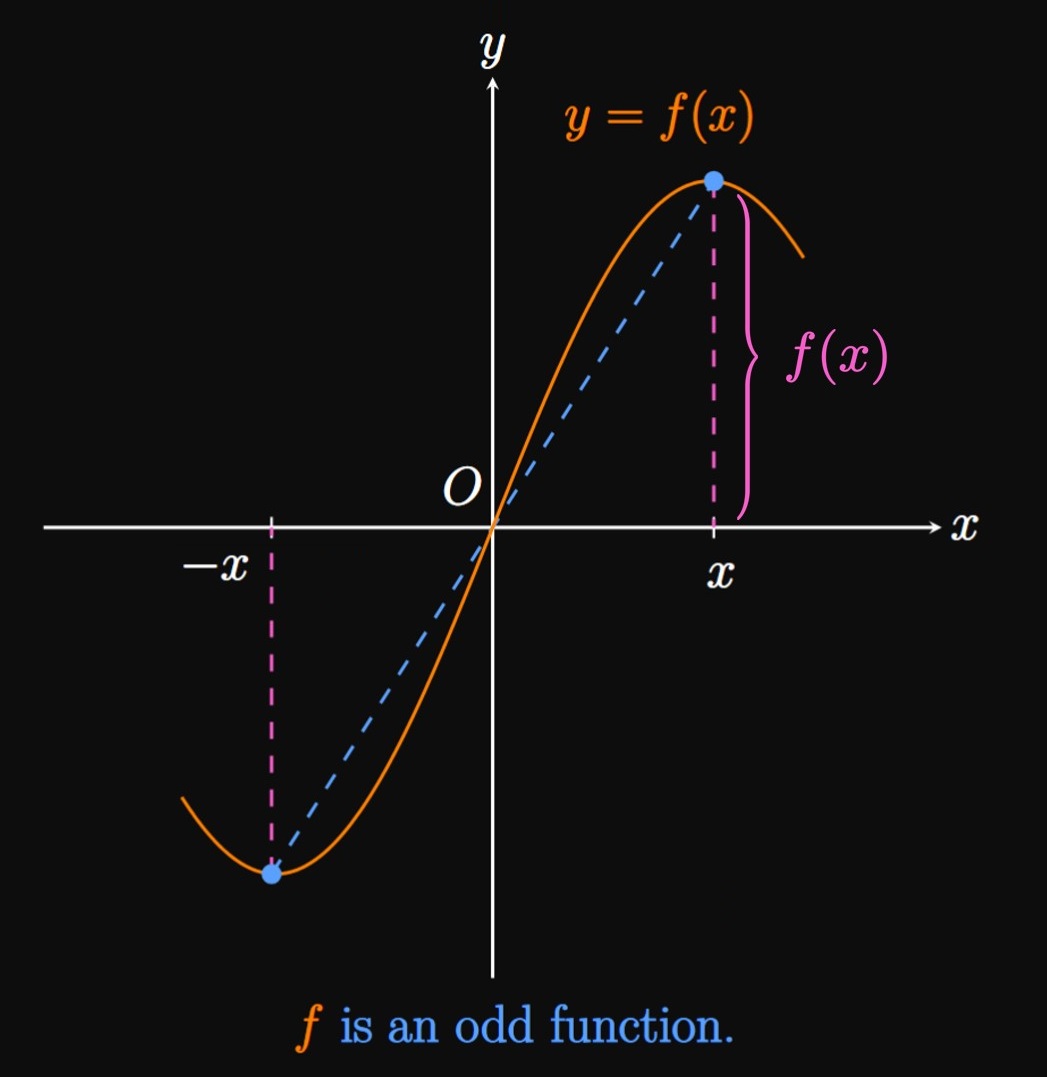
Functions can be categorized as even, odd, or neither. A function \(f\) is called even if and only if \(f(-x) = f(x)\) is true for all \(x\) and \(-x\) in the domain. If so, then the graph of \(y = f(x)\) is symmetric about the \(y\)-axis (Figure 9A). In words, the function becomes unchanged if \(x\) is replaced with \(-x.\) Conversely, \(f\) is called odd if and only if \(f(-x) = -f(x)\) is true for all \(x\) and \(-x\) in the domain. Then the graph of \(y = f(x)\) is symmetric about the origin, meaning the point \((x, f(x))\) can be rotated \(180 \degree\) about the origin to attain the point \((-x, f(-x)).\) (See Figure 9B.) Hence, if we already know the graph of \(f\) for \(x \geq 0,\) then the entire graph is acquired by rotating this portion about the origin by \(180 \degree.\)
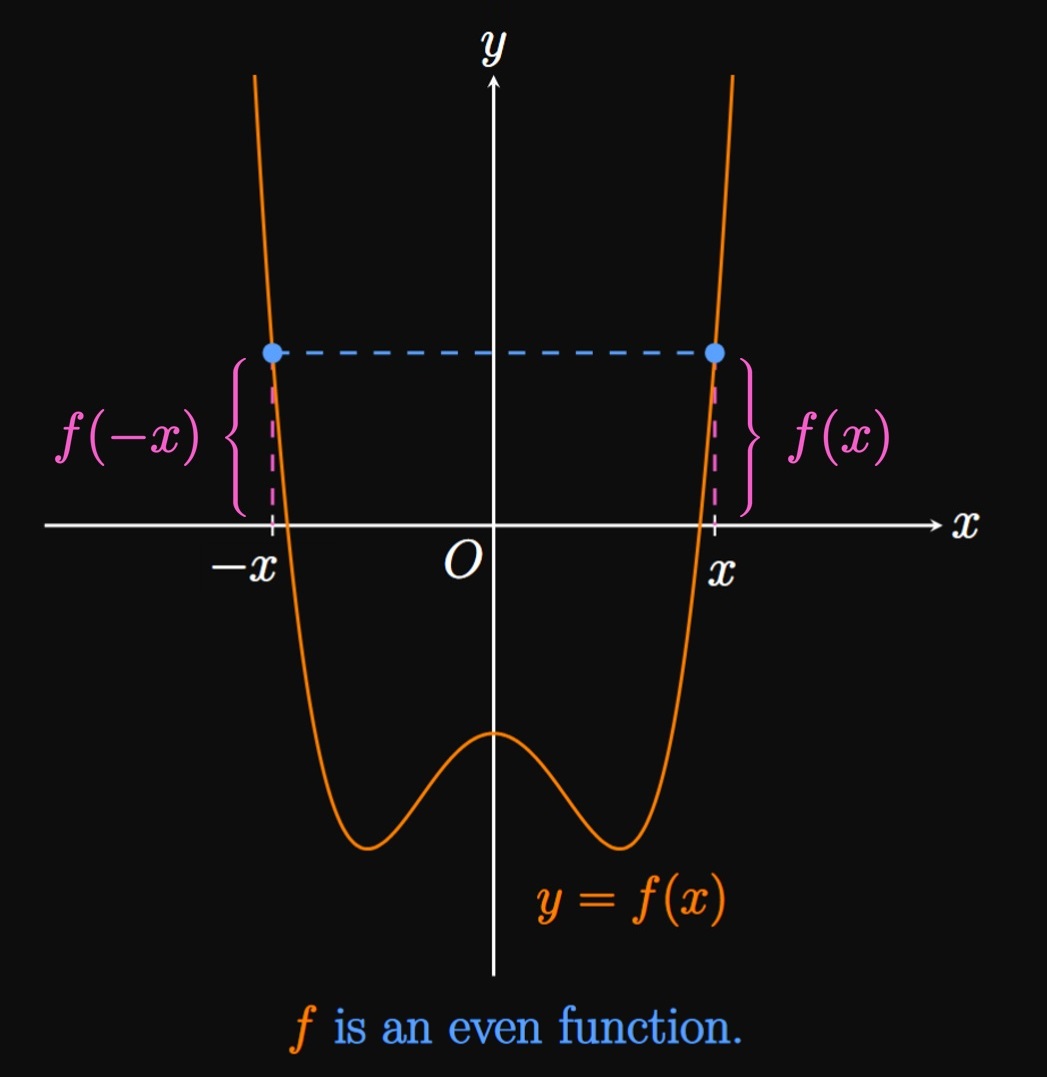
- even if and only if \(f(-x) = f(x)\) for all \(x\) and \(-x\) in its domain.
- odd if and only if \(f(-x) = -f(x)\) for all \(x\) and \(-x\) in its domain.
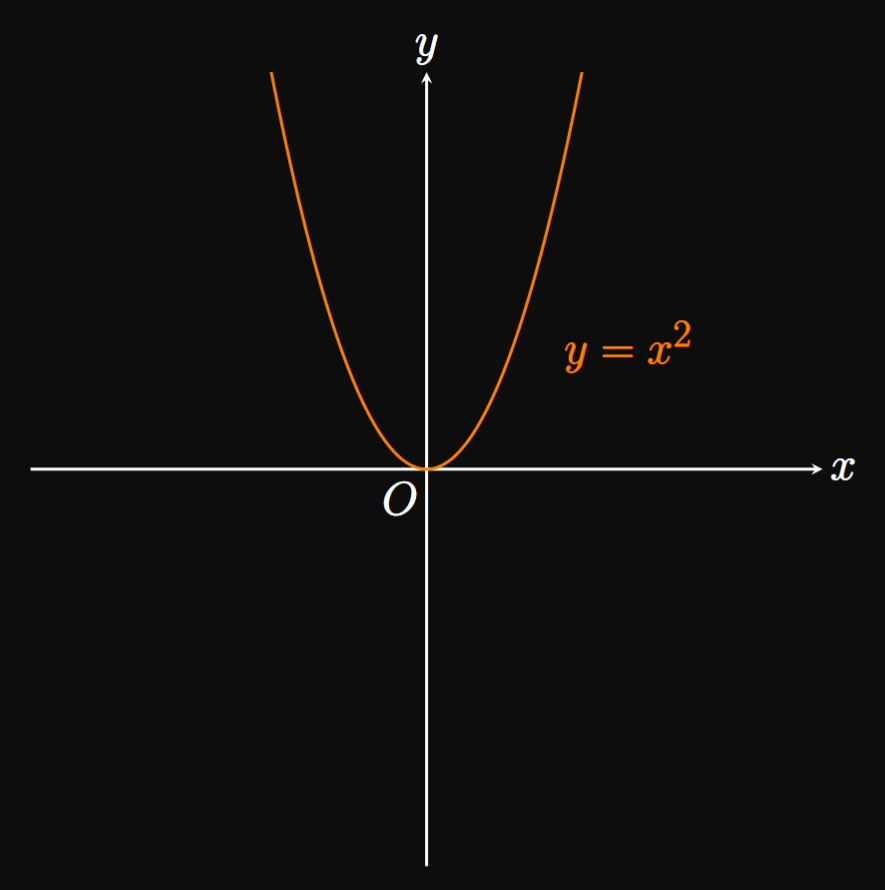
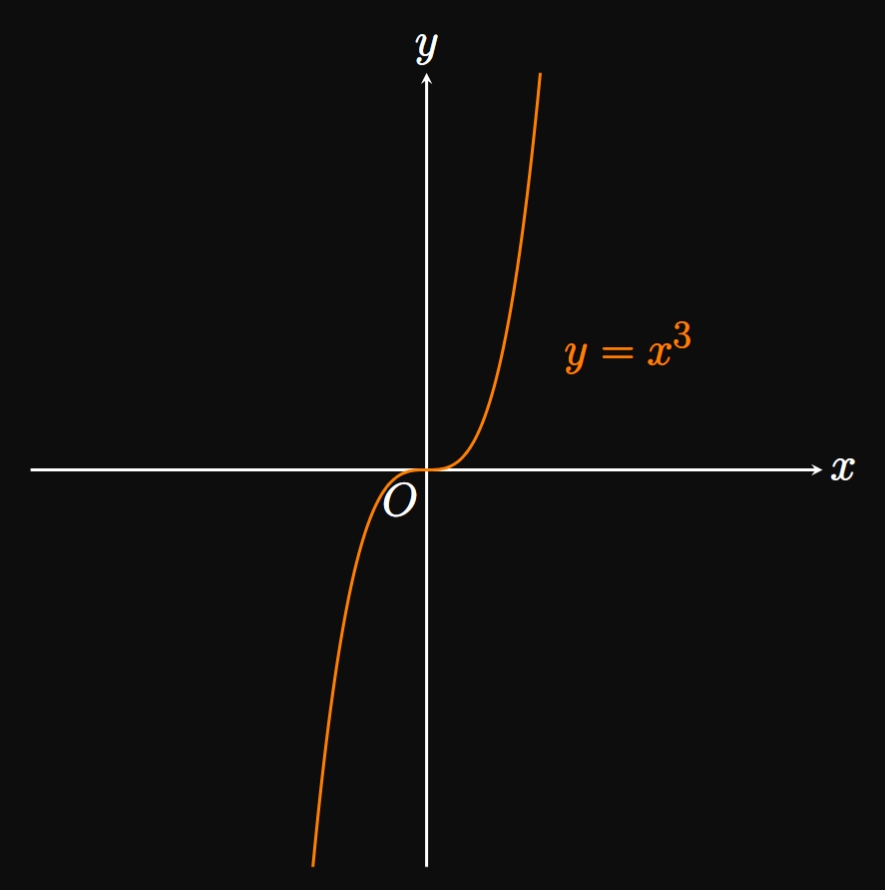
For example, the function \(f(x) = x^2\) is even because for all \(x,\) \[f(-x) = (-x)^2 = x^2 = f(x) \pd\] The graph of \(y = x^2\) is called a parabola, a symmetrical U-shaped curve (Figure 10A), which we will study further in Section 0.7. In contrast, the cubic function \(g(x) = x^3\) is odd since for all \(x,\) \[g(-x) = (-x)^3 = -x^3 = -g(x) \pd\] (See Figure 10B.)
- \(f(x) = x^4 - 1\)
- \(g(x) = x^7 + 4x\)
- \(h(x) = x^2 + 6x\)
- Note that \[ \ba f(-x) &= (-x)^4 - 1 \nl &= x^4 - 1 = f(x) \pd \ea \] Since \(f(-x) = f(x),\) \(f\) is even.
- We see \[ \ba g(-x) &= (-x)^7 + 4(-x) \nl &= -x^7 - 4x \nl &= - (x^7 + 4x) = -g(x) \pd \ea \] Because \(g(-x) = -g(x),\) \(g\) is odd.
- We observe that \[ \ba h(-x) &= (-x)^2 + 6(-x) \nl &= x^2 - 6x \pd \ea \] But \(h(-x) \ne h(x)\) and \(h(-x) \ne -h(x),\) so \(h\) is neither even nor odd.
Defining a Function A function \(f\) is a mathematical rule that maps each element \(x\) in the domain \(D\) to exactly one element, \(f(x),\) in the range \(E.\) We can describe functions verbally, visually, numerically, or algebraically. The most common way of communicating a function is through a graph, which consists of all ordered pairs \[\{(x, f(x)) \mid x \in D\} \pd\] The Vertical Line Test says that a curve in the \(xy\)-plane represents a function of \(x\) if and only if no vertical line intersects the curve multiple times.
Piecewise Functions A piecewise function is defined by different subfunctions for various parts of its domain. For example, the absolute value function can be defined by \begin{equation} \abs x = \bc x \; \; &x \geq 0 \nl -x \; \; &x \lt 0 \pd \ec \eqlabel{eq:abs-cases} \end{equation}
Even and Odd Functions A function \(f\) is
- even if and only if \(f(-x) = f(x)\) for all \(x\) and \(-x\) in its domain.
- odd if and only if \(f(-x) = -f(x)\) for all \(x\) and \(-x\) in its domain.
Graphs of even functions are symmetric about the \(y\)-axis. In contrast, graphs of odd functions are symmetric about the origin, meaning \((x, f(x))\) can be rotated \(180 \degree\) about the origin to obtain \((-x, f(-x)).\)